")
Motorola Solutions, Inc. (NYSE:MSI) is a Technology company operating segments within the Communications Equipment, Electronic Equipment & Instruments and Application Software Sub-industries. It has had a stable revenue increase over the past 10 years with an average growth of 4.05%. The company’s solutions include land mobile radio communications (LMR), video security products and command center software. The company’s largest customers include US and UK government agencies and departments. Given the critical nature and security of the products it offers, we explore how it maintains its innovative advantage and how the US government plays a role in its competitive positioning.
Acquisition Strategy
From the company’s presentation, it mentioned about the accretive acquisitions it has had over the past.
Motorola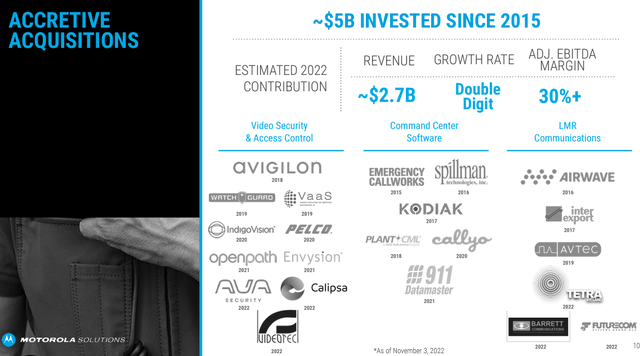
We analyzed its organic and inorganic revenue to determine the impact of its acquisitions. Based on the $2.7 bln in accumulated inorganic revenue that the company disclosed, we calculated the average annual inorganic revenue contribution from acquisitions that the company achieves each year as per the table below. To understand its acquisitions further, we looked through the company’s annual reports over the past 8 years and categorized all these acquisitions by date of acquisition, purchase price, and segment. We identified a total of 27 acquisitions the company undertook over the past 8 years.
|
Motorola Organic and Inorganic Revenue ($ mln) |
2015 |
2016 |
2017 |
2018 |
2019 |
2020 |
2021 |
2022 |
Average |
|
Organic Revenue |
5,358 |
5,701 |
6,043 |
7,006 |
7,550 |
7,077 |
7,834 |
8,775 |
|
|
Growth Contribution % |
-8.9% |
0.1% |
0.1% |
9.8% |
2.8% |
-10.3% |
5.7% |
7.4% |
0.8% |
|
Inorganic Revenue |
338 |
338 |
338 |
338 |
338 |
338 |
338 |
338 |
|
|
Growth Contribution % |
5.7% |
5.9% |
5.6% |
5.3% |
4.6% |
4.3% |
4.6% |
4.1% |
5.0% |
|
Total |
5,695 |
6,038 |
6,380 |
7,343 |
7,887 |
7,414 |
8,171 |
9,112 |
|
|
Growth % |
-3.2% |
6.0% |
5.7% |
15.1% |
7.4% |
-6.0% |
10.2% |
11.5% |
5.8% |
|
Number of Acquisitions |
2 |
2 |
2 |
2 |
4 |
5 |
3 |
7 |
|
|
Average Revenue per Acquisition |
168.8 |
168.8 |
168.8 |
168.8 |
84.4 |
67.5 |
112.5 |
48.2 |
123.4 |
|
Acquisition Cost |
586 |
1,474 |
404 |
1,164 |
709 |
287 |
521 |
1,177 |
790.3 |
|
Average Cost per Acquisition |
293 |
737 |
202 |
582 |
177 |
57 |
174 |
168 |
298.8 |
|
Average P/S |
1.74 |
4.37 |
1.20 |
3.45 |
2.10 |
0.85 |
1.54 |
3.49 |
2.3 |
Source: Company Data, Khaveen Investments
We can see that the average inorganic revenue contribution is quite significant, representing 5.0% of the average revenue growth of 5.8%. However, 5% is very average growth, and neither is the $123.4 mln in revenue generated per acquisition. This is not surprising as the average acquisition cost is only $299 mln, most of them being under $100 mln. Only 2 of these acquisitions breached the $500 mln price mark (Rave Mobile for $553 mln & Avigilion for $974 mln). The average P/S therefore translates to 2.3x.
To understand its acquisitions further, we looked through the company’s annual reports over the past 8 years and categorized all these acquisitions by date of acquisition, purchase price, and segment. We identified a total of 27 acquisitions the company undertook over the past 8 years.
|
Motorola Acquisitions by Segment |
2015 |
2016 |
2017 |
2018 |
2019 |
2020 |
2021 |
2022 |
Total |
|
LMR |
1 |
2 |
1 |
2 |
0 |
3 |
9 |
||
|
Video |
1 |
3 |
2 |
2 |
3 |
11 |
|||
|
Command Center |
2 |
1 |
1 |
1 |
1 |
1 |
7 |
||
|
Total Acquisitions |
2 |
2 |
2 |
2 |
4 |
5 |
3 |
7 |
27 |
Source: Company Data, Khaveen Investments
Strategically, we see the acquisitions quite balanced over the segments, but believe the company is more focused on the Video segment considering it represented less than 5% of the company’s revenue 5 years ago but has since achieved an average of 43.2% growth rate to now represent > 20% of total revenue.
|
Motorola Segment Revenue ($ mln) |
2018 |
2019 |
2020 |
2021 |
2022 |
2023F* |
4-year Average |
|
LMR Communications |
6,598 |
6,721 |
6,000 |
6,408 |
6,987 |
7,668 |
|
|
Growth % |
1.9% |
-10.7% |
6.8% |
9.0% |
9.7% |
1.7% |
|
|
Video |
382 |
709 |
927 |
1,226 |
1,523 |
1,730 |
|
|
Growth % |
85.6% |
30.7% |
32.3% |
24.2% |
13.6% |
43.2% |
|
|
Command Center |
363 |
457 |
487 |
537 |
602 |
742 |
|
|
Growth % |
25.9% |
6.6% |
10.3% |
12.1% |
23.3% |
13.7% |
|
|
Total |
7,343 |
7,887 |
7,414 |
8,171 |
9,112 |
10,140 |
|
|
Growth % |
7.4% |
-6.0% |
10.2% |
11.5% |
11.3% |
5.8% |
*Based on Q3 YTD 2023 Growth YoY
Source: Company Data, Khaveen Investments
Overall, we view the company’s acquisition strategy favorably as it has some strategic focus towards its video segment as well as efficient use of its cash with the average purchase value P/S of just 2.3x which is lower than the Technology Sector median of 2.61x, as well as Motorola’s own 5-year average P/S of 4.15X.
Outlook
While the company has not made any acquisitions YTD until Q3 2023, Motorola’s CEO highlighted that he expects “some continued M&A” as well as highlighted its priority on video security and access control from its latest earnings briefing. Thus, we believe future M&A activity could contribute positively to its growth outlook, especially for the Video segment which has slowed down in Q1 to Q3 YTD compared to the previous year (13.6% YoY). We do note, however, that the company’s historical revenue contribution of $299 mln only represents around 4% of total revenue, which is not very significant to overall growth.
Government Protected Market Position
In 2021, the US implemented the Secure Equipment Act which prevents the FCC from approving new equipment licenses for companies placed under the Covered Equipment or Services List. This includes “telecommunications equipment” and “video surveillance equipment” from Chinese companies including Huawei, ZTE, Hikvision, Hytera and Dahua Technology. The ban even extends to the “subsidiaries and affiliates” of affected companies. Additionally, while the scope of the ban only prohibits these companies from selling new equipment, the FCC in 2023 indicated that it is studying expanding the ban to cover even equipment that had been previously approved by the FCC.
FCC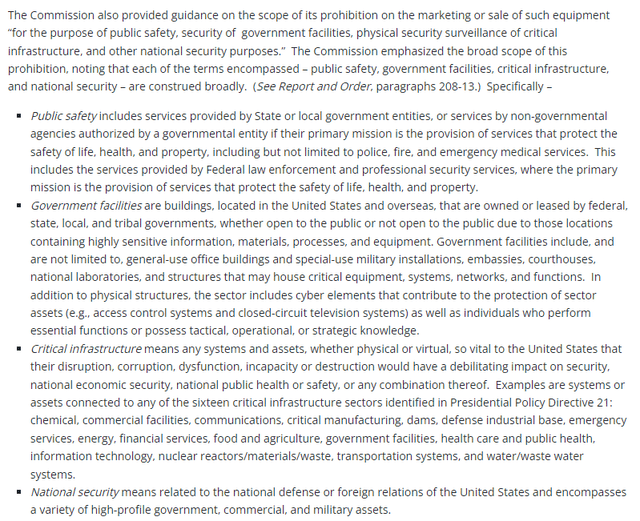
Furthermore, the FCC highlighted the rationale of the ban to protect national security. Based on the image, we believe the scope of the ban highlights the significance of the types of equipment that are produced by Motorola. For example, its LMR segment includes radio communications equipment which could be “critical infrastructure” as it serves both government and large commercial customers. The LMR segment communications products are also used by various first responders such as law enforcement agencies and could be deemed critical for “public safety”. Moreover, its Video segment includes surveillance systems for the government customers which could be used in government facilities. Finally, its Command Center segment’s software products could also be critical to “public safety” and it is used by emergency services.
Motorola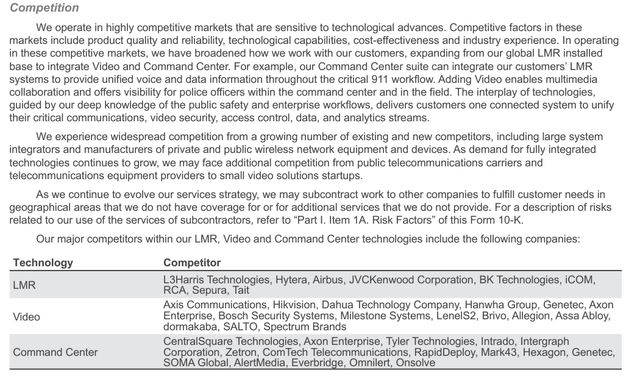
Motorola themselves have stated that the market is highly competitive. We believe, however, that the US ban has created a protective barrier against foreign competitors, especially from China that have large market shares in these areas. We analyze this further by compiling market share breakdowns of each company within Motorola’s two largest segments LMR (Mission Critical Communication) and Video (Imaging Security End-System) representing 77% and 17% of total revenue respectively.
Company Data, The Insight Partners, Khaveen Investments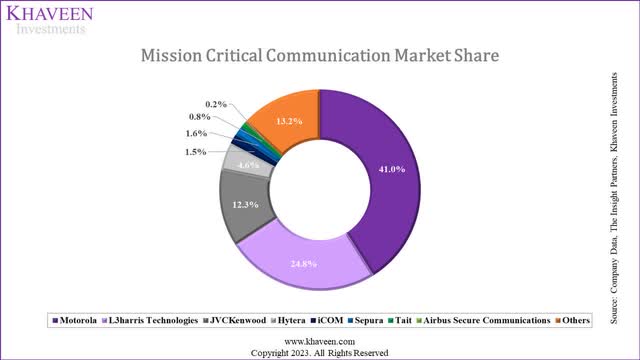
In terms of the mission-critical communications market share for the company’s LMR segment, Motorola leads with a 41% market share based on our calculations of its 2022 revenue. Fourth-placed Chinese competitor, Hytera with a market share of 4.6% is included in the FCC equipment ban. Hence, we believe Motorola’s dominant position has been further protected by the ban, allowing it at the very least to maintain its grip on the market.
Yole Development, Khaveen Investments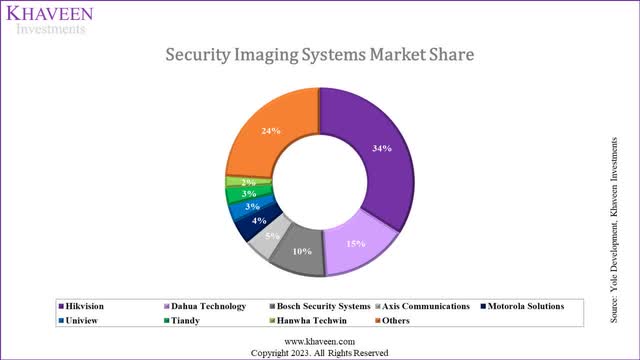
For its Video segment, however, the company has a smaller market share of only 4%. The security imaging systems market is dominated by Chinese competitors Hikvision and Dahua Technology with a combined share of 49%. However, both these companies are under the scope of the FCC equipment ban. Additionally, Chinese competitor Tiandy is not included in the FCC ban but the US government had placed export restrictions on US components to the company. Furthermore, certain Uniview models that feature chips made by HiSilicon are banned for sale in the US. These companies translate to a 6% market share.
For the last segment of the company (Command Center), we did not identify any of its competitors subject to bans, but we believe the segment is the least important as it represents only 6.6% of total revenue.
We, therefore, believe that Motorola, while not a large player in the market, could benefit from the ban, with 49% of the market impeded by the FCC ban, and a further 6% imposed with additional restrictions.
Outlook
Moving forward, we believe that more restrictions could be placed on these key critical infrastructures, which would only strengthen the company’s defensive moat moving forward. For example, the US FCC had proposed to increase its authority to remove Chinese-based equipment from US networks. Furthermore, several retailers have stopped selling Dahua surveillance equipment and US lawmakers have been engaging with Costco which was reported to still be selling Dahua equipment. Besides the US, the UK government also announced new rules for governmental departments to stop using “surveillance equipment produced by companies subject to China’s National Intelligence Law”.
Highly Regulated Market Provides Government Opportunities
The company’s largest customers are the US and UK governments as mentioned, with each representing 7% of its revenue.
Motorola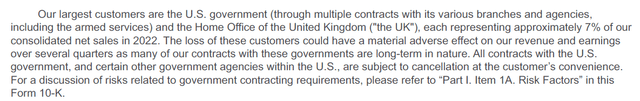
While it is mentioned that the US and UK governments only contribute about 14% in total, the remaining large commercial companies under its direct segment (70.5% revenue) are subject to intense regulatory constraints as well as Motorola in providing to them.
Motorola
As the industry is highly regulated, we believe the company’s customers, including large commercial customers, would also be subject to stringent industry regulations. For example, the table below shows several of the company’s customers which are stated from the company’s website. We compiled the table with its customers based on category, type of customer and segment.
We classified the company’s customers below based on Commercial, Large Commercial and Government.
- Large Commercial: We classified Large Commercial companies with over $1 bln in revenue or companies that could be deemed as critical infrastructure as defined by the FCC (including “chemical, commercial facilities, communications, critical manufacturing, dams, energy, financial services, food and agriculture, health care and public health, information technology, nuclear reactors/materials/waste, transportation systems, and water/wastewater systems”) except government facilities. For example, this includes the Nikola Tesla Airport which falls under transportation systems and energy company Glassco.
- Commercial: We classified Commercial companies that do not meet the criteria as Large Commercial, with less than $1 bln in revenue or companies that are not deemed as critical infrastructure as defined by the FCC. This would include several of Motorola’s retail and hospitality customers such as Meadowhall Shopping Centre and Sun International.
- Government: Includes public safety agencies at a state, local or federal level such as police, fire and emergency services.
We also classified which segments each customer belongs to based on the product examples as stated on the company’s website.
|
Customer |
Category |
Type of Customer |
Segment |
|
Meadowhall Shopping Centre |
Retail |
Commercial |
LMR |
|
Mall Of America |
Retail |
Commercial |
LMR |
|
European DIY Store |
Retail |
Commercial |
LMR |
|
Ace Hardware |
Retail |
Large Commercial |
LMR |
|
Claridge’s Hotel |
Hospitality |
Commercial |
LMR |
|
Fairmont The Palm |
Hospitality |
Commercial |
LMR |
|
San Siro And Red Cross Italy |
Hospitality |
Commercial |
LMR |
|
Sun International |
Hospitality |
Commercial |
LMR |
|
Rheinbahn AG |
Transport |
Large Commercial |
LMR |
|
Nikola Telsa Airport |
Transport |
Large Commercial |
LMR |
|
Minimetro S.P.A |
Transport |
Large Commercial |
LMR |
|
Mpk Wloclawek |
Transport |
Large Commercial |
LMR |
|
Port Atlantique La Rochelle |
Logistics |
Large Commercial |
LMR |
|
Mercedes-Benz Manufacturing Hungary (OTCPK:MBGAF) |
Manufacturing |
Large Commercial |
LMR |
|
EWR Netz GmbH |
Utilities |
Large Commercial |
LMR |
|
Vattenfall Europe Distribution |
Utilities |
Large Commercial |
LMR |
|
Impala Platinum (OTCQX:IMPUY) |
Mining, Oil & Gas |
Large Commercial |
LMR |
|
Gassco AS |
Mining, Oil & Gas |
Large Commercial |
LMR |
Source: Company Data, Khaveen Investments
While the company did not disclose its breakdown of customers by this categorization, it did break down its revenue by direct and indirect customers.
Motorola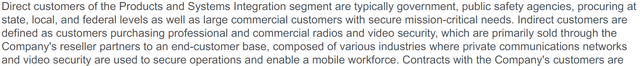
As stated by the company, its direct customers include government and large commercial customers, and indirect include small commercial customers and resellers.
|
Motorola Revenue by Customer Type ($ mln) |
2018 |
2019 |
2020 |
2021 |
2022 |
Q3 YTD 2023 |
|
Direct |
5,451 |
5,836 |
5,549 |
5,989 |
6,425 |
4,988 |
|
Indirect |
1,892 |
2,051 |
1,865 |
2,182 |
2,687 |
2,141 |
|
Total |
7,343 |
7,887 |
7,414 |
8,171 |
9,112 |
7,129 |
|
Growth % |
7.4% |
-6.0% |
10.2% |
11.5% |
11.3% |
Source: Company Data, Khaveen Investments
As such, we believe as much as 70% (direct segment) is exposed to these higher industry regulations. While we believe this segment proves complicated to cater to, we also believe that these customers could be sticky with higher regulatory implications for switching suppliers.
Outlook
Given the critical nature of the company’s product offerings, it is well-positioned to benefit from ongoing national security expenditure from the government. Our view was confirmed by company management, who confirmed national defense-related contracts procured.
It’s Department of Defense. It’s civil, it’s law enforcement, it’s multiyear. So we’re really pleased with what happened in federal. And then when you start to think about some of the federal supplemental requests, one of the items in there is $106 billion for the critical national security, which is going to fund Ukraine and Israel. What I would highlight is during the course of this year, we’ve actually shipped $100 million into Ukraine, a little greater than $100 million at this point in time. – Jack Molloy, EVP and COO
Risk: Foreign Regulatory Bans
We believe the same regulatory constraints that have affected Motorola’s foreign competitors to the benefit of Motorola, could disadvantage Motorola if the same equivalent laws are passed outside the US, especially in China. This could affect Motorola’s international revenue (30% of the total), but we believe only a small portion of this would be from China based on the list of customers we compiled.
Verdict
In summary, we believe Motorola’s acquisition strategy highlights its focus on its Video segment which has had superb growth of 43.2% on average and now accounts for a significant portion of revenues greater than 20%. In relation, we view its strategy favorably with efficient use of cash as its average purchase value P/S (2.3x) is lower than the Technology sector median (2.61x) and company average (4.15x).
Furthermore, we believe as high as 70% of the company revenues are exposed to stringent industry regulations which could be positive customer stickiness due to high regulatory implications for switching suppliers. In relation, following the US ban on Chinese competitors, we believe this benefits Motorola in both LMR and Video segments which represent 77% and 17% of its total revenue respectively. We believe the US ban would allow Motorola to maintain its dominant position in the LMR segment, whereas in the Video segment, we believe Motorola could benefit from the ban with 49% of the market affected by the ban.
However, based on analysts’ consensus, the company’s stock is already fairly valued based on the price target of $310.51, with its P/E ratio of 26.52x being higher than the sector median of 18.64x, thus we rate the company as a Hold.
Read the full article here