")
Small-cap stocks have had quite the run to end 2023. They’ve been chronic underperformers for years, languishing as the larger-cap indices have flown to new highs. However, that has ended, and small caps are well and truly leading the way right now. Given the way money is rotating into small-cap stocks, the fact that the index has broken out of its multi-year range, and its correlation to declining interest rates, I believe the iShares Russell 2000 ETF (NYSEARCA:IWM) is a tremendous long opportunity heading into 2024.
Before we dig into the bull case, there is a significant caveat short term, from extreme overbought conditions and out-of-control sentiment. However, once these temporary issues have passed, the IWM should be off to the races again.
A major breakout
The IWM was in a range of about $160 to about $197 for the better part of two years, as you can see below in the weekly chart. Keep in mind that the Nasdaq (COMP.IND) and S&P (SP500) indices have made new highs in that time frame, while the IWM was simply rangebound. That, however, is no more.
StockCharts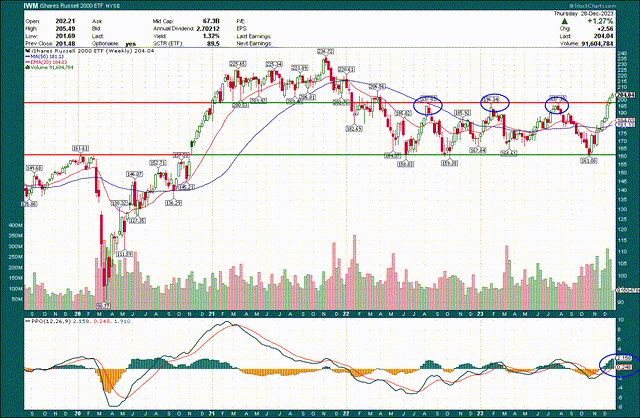
The triple top at ~$197 was cleared in a big way, and the IWM is now at $204, trading above the breakout range for a couple of weeks now. In my view, this amount of time ahead of the prior trading range confirms the breakout.
I’ve noted the weekly PPO is actually quite low despite the fact that we’ve seen an absolutely epic rally in the past two months, and on the weekly chart, IWM can go a long, long way higher before it’s overbought. That’s exactly what I think will happen.
If we zoom in to the daily chart, we can see high levels of bullish behavior, but lots of reasons for short-term caution.
I’ve noted the breakout level with the support lines drawn in below, so you can see the line in the sand for the bulls. I’d really like to see IWM come back and test the $197 area – or something close to it – and then bounce higher again. Whether we get that or not remains to be seen, but the bottom line is as long as the IWM is ahead of the prior trading range, it’s a buy.
StockCharts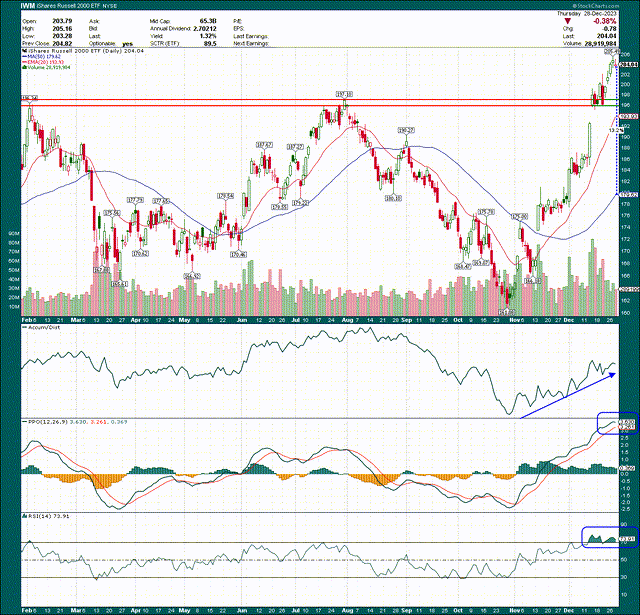
The caution comes in with the extremely overbought nature of the index right now. Take your pick but basically everything is screaming for a pullback of some time. The index is a staggering 13% ahead of its sharply rising 50-day simple moving average. The PPO is 3.6, which is the highest value we’ve seen in some time. The 14-day RSI is still over 70, well into overbought territory.
Now, while these indicators are showing that IWM has seen relentless buying pressure, this is also highly indicative of bull market behavior. So, while I think the IWM needs a pullback to consolidate some of these recent gains, it also gives me lots of confidence that this breakout is the real deal and that IWM is going to continue to march higher into next year.
Sentiment is extremely stretched
There are lots of ways to measure sentiment, and they all have their merits. However, I prefer the objective ones that simply follow where money is flowing rather than sentiment surveys, for instance. The charts don’t lie, and below, I have a selection of sentiment indicators that all point to one thing, and that is the fact that bullish sentiment on Wall Street is extremely prevalent. Given sentiment is a contrarian indicator, I’m on high alert for a pullback.
Before we look at these, let me say one more time that none of this changes my view that IWM is a buy over $197; this is simply a short-term note of caution.
StockCharts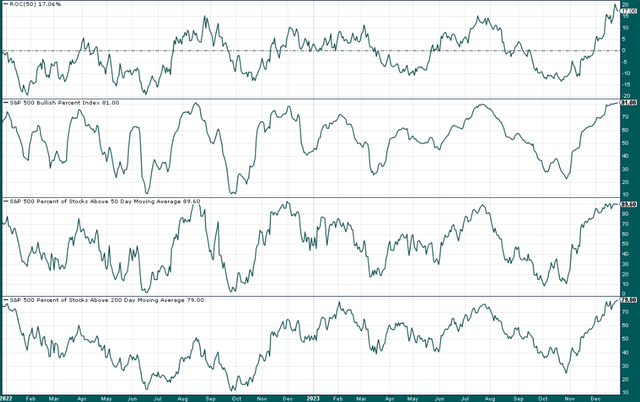
The first panel is simply the 50-day rate of change of the IWM. This is the cumulative price action for the past 50 days, charted in line format. We can see the most recent reading of +17% is stretched. This by itself isn’t a sell signal by any means, but it does show that the bullish action we’ve seen has been quite one-sided.
The second panel is the bullish percent index for the S&P 500. I know the S&P 500 and IWM are not the same thing, but these sentiment indicators apply to all equities, and their signals are quite valuable for the IWM as well.
The BPI is currently 82, which has very reliably marked short-term tops in equities in the past couple of years. This does not mean it cannot go higher, but the odds of a pullback are quite elevated based upon this signal’s reliability in the recent past.
The bottom two panels are the percentages of S&P 500 stocks over their 50-day and 200-day moving averages, respectively. Again, these are quite reliable in terms of calling short-term tops and bottoms, and right now, both are at extreme levels that have generated short-term tops.
Sentiment, in my view, is the biggest reason to be cautious on equities right now. When trading is as one-sided as it has been recently, I get concerned.
Interest rates and seasonality
There are other considerations besides the price chart itself and short-term sentiment issues, and we’ll take a look at those now. While sentiment is a short-term negative, interest rates and seasonality are medium-term positives, and again, support my buy rating on the IWM. Let’s start with a chart of the 10-year Treasury rate (US10Y).
StockCharts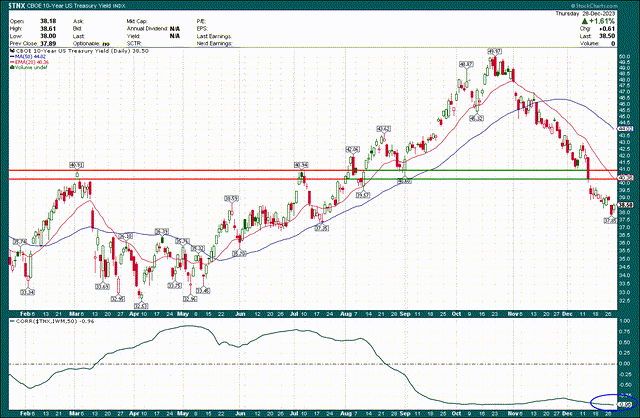
We all know rates plummeted months ago and are well below their prior highs. That’s been terrific for equities, but check out the correlation to the IWM in the bottom panel. What this says is that over a 50-day rolling period, the IWM and the 10-year Treasury have a correlation of -0.96, meaning they are moving almost perfectly inversely to one another.
So long as the 10-year yield remains below that critical level between about 4.00% and 4.10%, based on this data, the IWM has bullish tailwinds from rates.
Finally, seasonality also favors the bulls. Below is data from the past five years, and what it shows is that January is generally quite a good month for small caps.
StockCharts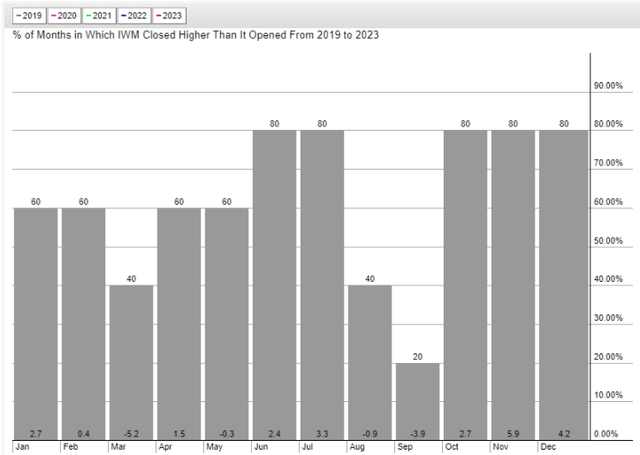
January’s average gain in the past five years is 2.7%, or 32.4% annualized. IWM’s average annualized gain per month for the whole year over this period is 12.8%, so January is nearly three times more bullish. That suggests this breakout rally has some staying power, at least over the next few weeks. Things start to get dicey in February and March, so that’s certainly something to keep in mind, but for now, this rally looks like it has legs to me.
Wrapping up
The rally we’ve seen in small caps in the past two months has been absolutely breathtaking. Money is very clearly rotating into the space, and as long as the IWM remains over $197, it’s a strong buy in my view. That said, we have some short-term issues that I find quite concerning, and I’d really like to see a small pullback and consolidation over $197 before the rally continues.
I’m placing a strong buy on iShares Russell 2000 ETF, with the caveat that short-term – I’m talking in days, not weeks – sentiment is unsustainably high. But once that is worked through, giddy up.
Read the full article here