
This article was first released to Systematic Income subscribers and free trials on May 9.
As many investors are gearing up for a recession over the coming year, Business Development Companies stand out as having unusually divergent views of whether they are good allocations at the current moment. Some investors think that BDCs should be avoided at all costs given the elevated risk of a recession. Other investors think that being at the “top of the capital structure” affords investors the greatest protection across the income investment space.
Our own view is more balanced, recognizing the attractive nature of the asset class (which we continue to hold in our Income Portfolios) as well as the risks. Although this nuanced approach is not particularly popular in the commentariat, it’s the one that we use in our analysis.
BDC Cheerleading Myths
In this section we take a closer look at and stress test the main cheerleading myths for holding BDCs.
Our goal here is not to say that BDCs are “bad” or inappropriate for income investors, but rather to ensure that investors are holding BDCs for the right reasons rather than the misleading and naive reasons they might encounter elsewhere.
One comment that you often hear is that BDCs are just like banks but much less leveraged, with leverage sub-2x versus bank leverage closer to 10x. This is a nonsensical comparison that’s totally devoid of context. For example, if we look at the balance sheet of JPM we see that loans make up less than a third of total assets. The rest are various forms of cash, Treasuries, Agencies, Municipal bonds, equipment and other assets. In a recession, many of these assets will either retain their value or will rally (as opposed to credit assets which are much more likely to struggle). If we look at just the “credit risky” loan portion of the balance sheet its leverage is much lower. It’s still higher than the average BDC but BDCs don’t have the kind of liquidity access that banks have such as via FHLB, the discount window, the new BTFP and others.
BDCs are also often pitched as benefiting from a recession because wider credit spreads create an additional margin of safety for credit investors and drive a higher level of income. Intuitively, this makes sense. After all, if credit spreads rise, prices of credit assets should fall. However, investors who have paid attention to the price dynamics of public and private assets know full well that private asset volatility is significantly lower than their public asset counterparts.
For example, while loan CEF NAVs fell around 23% over Q1 of 2020, BDC NAVs only fell around 9%, despite being much more highly leveraged and holding a greater share of higher-beta assets like common shares. While this dynamic offers a number of advantages to BDCs, it also means that BDC NAVs don’t fall by nearly as much as credit spreads imply. This also means that the margin of safety increases by less than it “should”.
This view also chooses to ignore the elephant in the room which is short-term rates. Changes in short-term rates have a much larger and more direct impact on BDC net income than changes in credit spreads. For example, according to various BDC managers, credit spreads have risen by about 1% since 2022. BDCs turn over their portfolios at a different rate but most are in the range of 0-10% per quarter. Compare the low and slow impact of credit spreads to the 5% change in short-term rates over the same period which affects 80-100% (i.e., the typical proportion of floating-rate assets) of the portfolio immediately.
Consider also the tendency of short-term rates to fall swiftly in case of a recession. We have already seen a 0.5% drop in 1Y Treasury yields since the start of the most recent bank tantrum despite a sticky level of inflation. Short rates fell in 2020 and during the GFC as well as the Fed cut rates. In short, a recession is much more likely to be a significant net negative for BDC net income than a positive.
Another key pitch for BDCs relies on the math of secured loan losses. The historical default rate for bank loans (used as a proxy) has been around 3% which translates into a, roughly, 1% annual loss rate, given a 70% historic recovery. Stress testing this to a 6% default rate leaves us with a portfolio loss of around 1.8%, very comfortably below the 9-11% yields delivered by BDCs.
This is misleading on a number of counts. One, BDCs don’t just hold senior secured loans. The average BDC holds around 79% in first-lien secured loans with the rest across second-lien loans, subordinated debt, preferreds, common equity and other assets. The historic recoveries on these types of assets range from 40% to zero, a far cry from the 70% historic average for first-lien secured loans.
Two, the 70% historic assumption for senior secured loans bears revising. Cov-lite deals have increased in recent years and these deals have a lower than average historic recovery. Loan-only issuers have proliferated and management teams have engaged in asset stripping and dubious accounting practices like EBITDA add-backs which understate corporate leverage. In short, loan recoveries are likely to be well below the historic 70% average going forward.
Three, if the historic averages were appropriate metrics for the BDC sector, we wouldn’t have car crash examples like Fifth Street or Medley BDCs. In short, not all secured loans are created equal and a BDC holding primarily secured loans can easily run into the ground with poor underwriting practices.
Even outside of BDCs that no longer exist, we can find many examples of existing BDCs with poor track records such as MFIC (formerly AINV). The BDC tends to lose chunks of its portfolio over each crisis and this fragile pattern is far from unique. In short, there are some higher-quality BDCs and some lower-quality BDCs and the historic loss calculation does not even approach a sensible analysis of the sector.
Systematic Income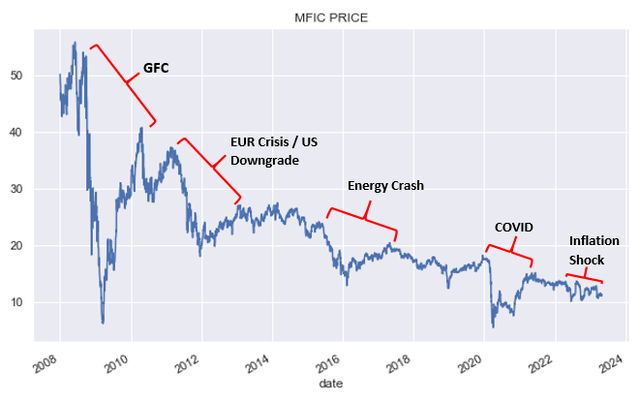
Four, the calculation of portfolio loss above leaves out an important factor which is leverage. The average BDC carries leverage of a bit over 1x meaning each 1% of portfolio loss is roughly doubled as far as the NAV is concerned.
Finally, the moves in the NAV, particularly if unexpected, are typically multiplied in price terms. For example, while NAVs fell less than 10% on average in the first quarter of 2020, the sector fell more than 50% in price terms, before recovering. Clearly this offered an attractive opportunity to double down for many strong hands, however, those investors who bought into the sector thinking they couldn’t possibly lose more than 2% were probably unpleasantly surprised and likely bailed near the lows, locking in losses.
Another supporting argument that came up recently in the context of the bank tremor. The argument here is that the likely lending pullback by the banks will be a strong benefit for BDCs because it will offer BDCs greater lending opportunities at better yields.
This could very well happen, but, once again, we need to think of the bigger picture and also consider the elements of scale and timeframe. The bigger picture here is that an environment where bank lending is scaled back i.e., a credit crunch is very likely to be one of moderate to severe recession. It’s worth asking then what could happen to corporate borrowers underlying BDC portfolios in that kind of poor macro environment and the likely answer is it wouldn’t be great. We are likely to see more non-accruals, an increase in defaults and a rise in realized and unrealized losses. We have already seen a significant uptick in non-accruals in the BDC sector over the last several quarters and that’s without yet going through a credit crunch.
This is where the impact of scale and timeframe kick in – elements that many BDC investors (and apparently analysts) misunderstand. A lending pullback by the banks will offer an advantage to some BDCs however that benefit will be relatively small-scale and will also take a significant amount of time to play out as BDCs turn over their portfolios.
The average leverage in the sector is around 1.2x which is fairly elevated and means that BDCs are not in a position to throw a ton of new capital at new opportunities. BDCs will instead have to take advantage of opportunities organically i.e., through repayments of current loans that free up capacity for new lending. However, in a tough macro environment repayments slow down significantly as the level of “exits” i.e., IPOs and M&A dry up (as they have since 2022). Moreover, NAVs are lower from 2022 which mechanically increases BDC leverage, further reducing capacity for new lending.
Even if BDCs can generate new lending, they will be doing so at unusually elevated levels of borrowing. Once we factor in leverage costs and management fees, the hurdle for generating net income on new assets is close to 8-9% i.e., for a BDC that makes a loan at 12% interest, only 3-4% of that loan will flow through to shareholders.
And, it’s important to remember that BDCs can’t fully step into bank shoes because the borrower base of the BDCs and banks don’t overlap very well. After all, BDCs were created by Congress precisely because the middle-market segment was not served particularly well by banks. Sure, some additional opportunities will open up for BDCs and that’s great, but a consideration of the bigger picture, scale and timeframe means we should curb our enthusiasm.
Stance And Takeaways
Our goal in this article was to make sure investors had a balanced view of BDCs. Much commentary out there is very one-sided, either telling investors to run for the hills (at all times, but particularly in bad times) or telling them everything is “rainbows and unicorns” (also at all times). The reality is more boring and nuanced with pros and cons on both sides. Gauging the balance of risks and rewards, rather than hunkering down or blissfully stepping over a precipice, is what income investing is all about.
Our view remains that BDCs have a strong role to play in all but the most defensive investor portfolios. However, an allocation to BDCs has to be done without denying the risks or viewing any potential challenge to the sector as an unadulterated blessing.
We have a number of BDC positions across our Income Portfolios. A couple worth highlighting are the Golub Capital BDC (GBDC), trading at a 9.8% yield and 9% discount to book and Owl Rock Capital Corp. (ORCC), trading at a 10.5% yield and 16% discount to book. The broader sector is trading at around a 9% discount to book value. This is about 10% below the historic average valuation which looks to be in the fair-value range.
Systematic Income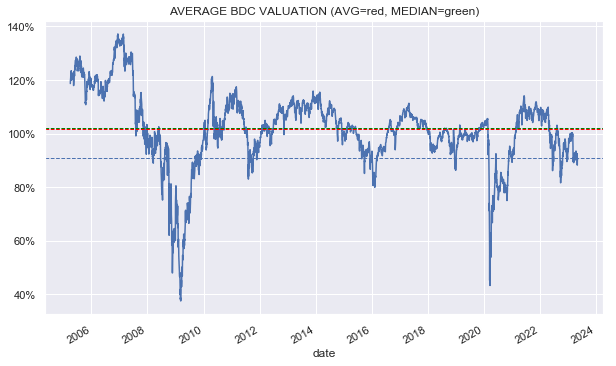
We pared our allocation to the sector when its valuation reached 100% in early March and would look to add to our position on a further sell off.
Read the full article here