Dear readers,
My previous coverage on the S&P 500 (NYSEARCA:SPY) was, particularly since the start of this year, focused on the short term. First, I issued a HOLD rating in an article called Time To Hedge, Here’s How and suggested that investors consider hedging their downside below 5,000 points via a zero cost option collar. The call was based on a perceived loss of momentum related to an increased risk of reaccelerating inflation and a Fed reluctance to cut interest rates. Then, more recently, I upgraded the index to a BUY in an article called Positive Outlook, I’m Modifying My Hedge and suggested unwinding half of the original hedge to retain all upside.
SA
The upgrade to a BUY, which has returned an RoR of about 6%, was based largely on the fact that (1) I saw inflation as very likely to decline under 2% in the latter half of this year, and (2) the market implied probabilities of rate cuts failed to take this decline into account. My thesis regarding the fall in inflation was related to the fact that the headline number, which stood at 3.5% at the time of my last article and has dropped to 3.4% since, continues to be skewed upwards due to the lagging nature of shelter and auto insurance CPI. I discussed the dynamics of this in detail in my last piece, concluded that it is only a question of time before we work through this lag and estimated that using real-time inflation data for these items, headline inflation would already be as low as 1.1%, well within the Fed’s 2% target.
I continue to hold the options discussed, and my short-term outlook on inflation has not changed in light of the most recent April inflation data. In this article, I want to take a longer-term approach and focus on what is the single most important driver of valuation in the long term – liquidity (i.e., the money supply).
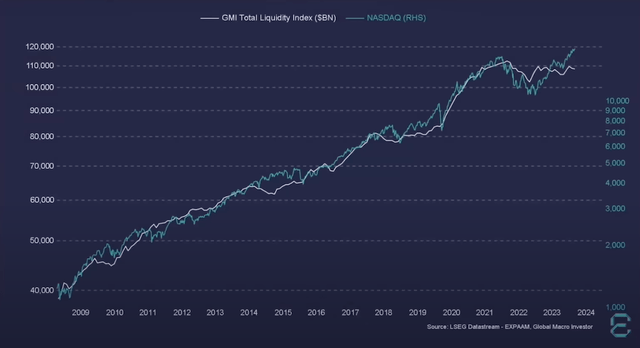
To show you just how important a driver this is, consider the chart below, which shows a 97.5% correlation between the global liquidity index and the NASDAQ 100 (NDX). And while I did not find this chart for the S&P 500, I assure you that the correlation would be just as high, as the two indices have largely moved in sync over the past 10-15 years. In fact, the only reason why broad market indices have outperformed the rise in liquidity is that they are in a secular growth trend due to improvements in technology. It logically follows that if we want to predict where prices will head in the future, we have to predict liquidity. Luckily, there are many clues to guide us on the way.
LSEG Datastream
Short-term liquidity outlook
Governments have four main tools to affect liquidity. Amongst the most well-known are (1) quantitative easing/tightening which is all about contracting/expanding the Fed’s balance sheet, and (2) the Fed funds rate, which affects all interest rates in the economy. Beyond these two, there are two more that really matter – (3) repo/reverse repo operations, and (4) the treasury’s general account.
Over the past year and half, the Fed’s balance sheet has shrunk from about $9 Trillion to $7.3 Trillion as they have pursued a tightening policy. They did this by selling off short-term bonds which they had accumulated during the pandemic. This, combined with interest rates in restrictive territory, has formed a relatively unfavorable backdrop for equities.

FRED
Going forward, however, I see three factors that are likely to significantly increase liquidity and therefore favorably affect asset prices, including the S&P 500.
1. A drained reverse repo
The Fed’s ability to reduce its balance sheet is very strongly tied to its repo/reverse repo operations. This is the program which allows commercial banks to deposit their money overnight at the Fed, and more importantly it is the easiest way for the Fed to influence money supply.
During 2021-2022 the Fed has bought unprecedented levels (about $2 Trillion) of these very short-term bond-like securities, but over the past year and half the reverse repo has been almost drained, meaning that the Fed is running out of easily sellable securities. Going forward, I expect that this will hinder their ability to withdraw liquidity from the market through this channel.

FRED
2. Falling interest rates
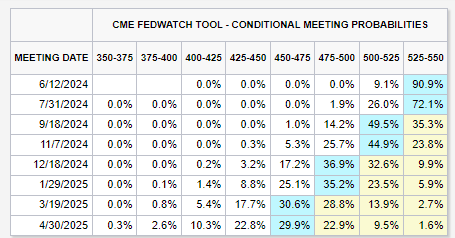
The Fed also seems quite likely to cut interest rates in the second half of this year, with the probability of at least one cut at 26% by July, 65% by September, and 76% by November. As argued in my previous article, I believe that these probabilities might increase further as inflation declines towards 2%. Moreover, the Fed is likely to be under considerable pressure come election time because of the ever-increasing government debt and rising interest payments (more on this later). Lower rates will inevitably lead to looser financial conditions and will unleash significant liquidity, likely in the second half of this year.
CME FedWatch Tool
3. Treasury spending
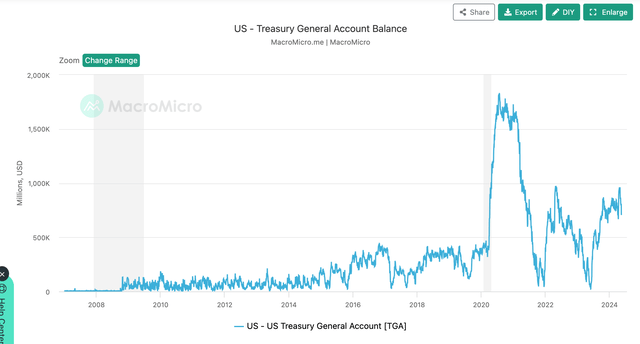
Finally, I expect treasury spending to pick up significantly around elections this fall, which will also add liquidity to the system. Since the fall of last year, Janet Yellen has been building up the Treasury general account from near zero to almost a Trillion dollars by collecting taxes, but not deploying all of that money right away. This has had a negative impact on liquidity, but I expect that as the election approaches, Yellen will start deploying that money, increasing liquidity in the process. Once again, I expect this to happen in the second half of this year.
Macro Micro
As a result of these three factors, I expect increased liquidity and a positive backdrop for the S&P 500 in the second half this year, and I would not be surprised to see the index close out the year above at least 5,500 points.
Long-term liquidity outlook
Over the long term, liquidity will be driven by demographics and a growing level of debt.
Right now, the U.S. has an aging population which is unlikely to support GDP growth above 2% per year and is likely to require ever-growing budget deficits to finance increasing social security liabilities.
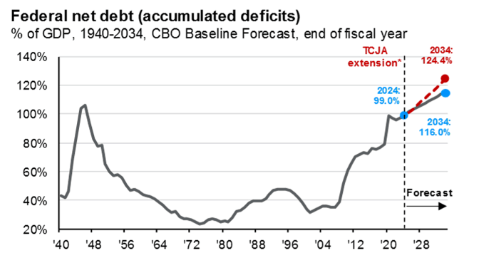
All this at a time when (1) public debt has reached 100% of GDP and is almost guaranteed to increase going forward,
J.P. Morgan Asset Management
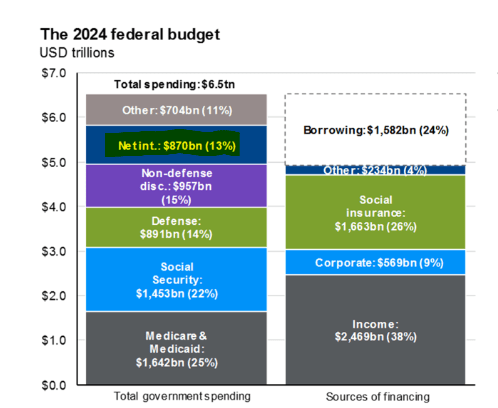
(2) debt servicing costs (i.e., net interest) already account for 13% of GDP,
J.P. Morgan Asset Management
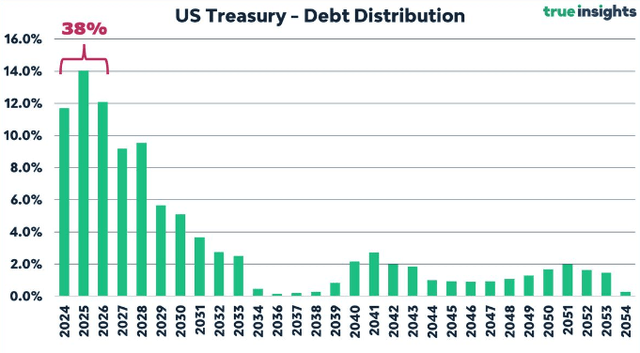
and (3) a significant amount of debt will need to be refinanced in just a couple years, likely at higher than existing rates.
True Insights
The cycle works as follows. Because of low economic growth and an aging population, the government runs a massive deficit. The only way to finance this deficit is to borrow more money. This increases an already large debt load and interest payments that then lead to an even bigger deficit. Then the cycle repeats.
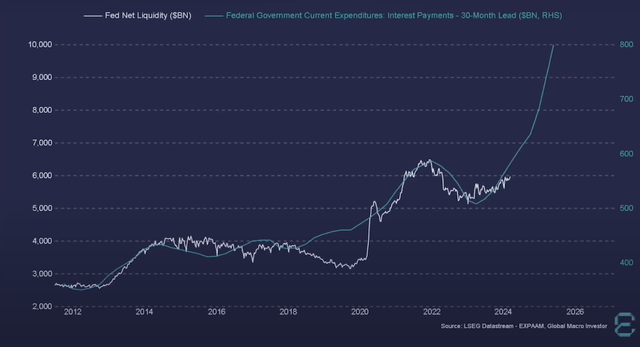
This has been the norm since 2008, but it wasn’t until recently that interest payments really started to compound. We now have pretty good visibility into future interest payments as a percentage of GDP, and it’s not a pretty picture, as interest payments are likely to skyrocket as a result of the compounding of interest and significant maturities coming due this and next year.
LSEG Datastream
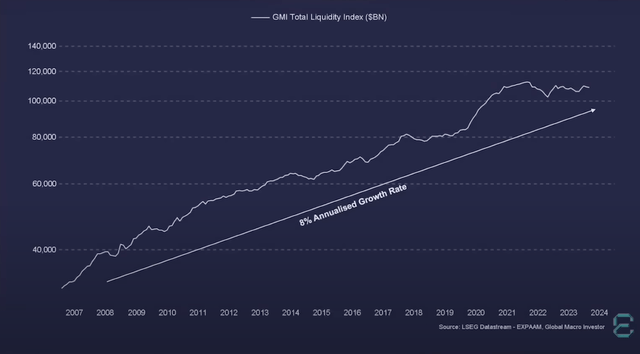
Such an increase in interest payments can only be supported by an increase in liquidity, which I believe is almost a guarantee at this point. This surge in liquidity should translate into asset price growth in the long-term and with a nearly one-to-one correlation between correlation and the S&P 500, it’s very likely that the index will continue to deliver at least the 10% returns we’ve become accustomed to.
Bottom Line
Tracking liquidity is great because it not only allows us to predict short-term price swings, but also guides us in making longer term financial decisions, thanks to a near perfect correlation to asset prices.
Over the past 15 years, global liquidity (which basically represents the debasement of currencies) has grown with a CAGR of 8%, only slightly below the average annual return of the S&P 500 of 10%. That means that by owning the index, investors are not getting ahead by much, but contrary to bonds and money market funds, they are at least preserving their buying power.
LSEG Datastream
For this reason, for lack of a better alternative, and despite a relatively expensive valuation, I reiterate my BUY rating for S&P 500 and continue to favor it against fixed income alternatives.
Read the full article here
